In my previous post, I showed how to make a 3D view of an area using the
persp function. However, I felt this was not a complete representation, especially for digital elevation. While looking for some reference for my presentation on the use of R for data analysis and visualization, I came across a thread discussing " 3d plot with different levels done in different colors (solution)". In this thread, a co-blogger
Tamas K Papp's shared his levelpersp function. Using this function I tried to plot 3D view of
Marinduque, Philippines using terrain and topo color.
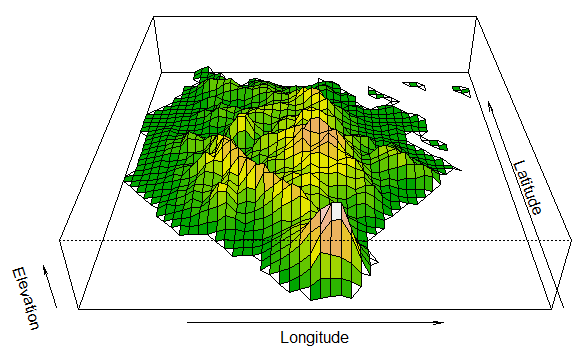 |
| 3D persp using terrain color |
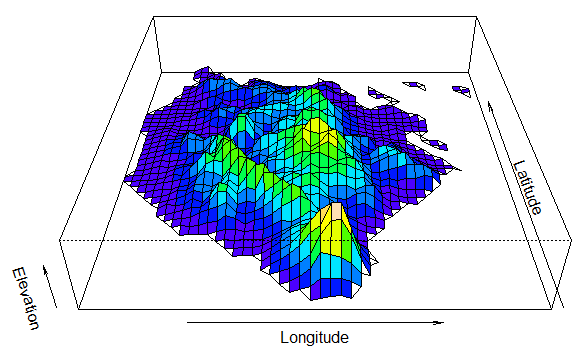 |
| 3D persp using topo color |

It would be great if you could link to the thread you found, and provide more explanation about what you did to generate these plots.
ReplyDeleteHi Brandon,
DeletePlease find below:
https://stat.ethz.ch/pipermail/r-help/2003-July/036151.html
sorry but what is the use of a plot without its code and data, is R a drawing competition
ReplyDeleteThis comment has been removed by the author.
ReplyDeleteHi Arnold! I really liked your plot and trying to do the same for an elevation map of Morocco.
ReplyDeleteI am using the following code to get a persp plot ok:
alt <- getData("alt", country="MAR")
adm <- getData("GADM", country="MAR", level=1)
#mar<-(adm[adm$NAME_1==”Marinduque”,])
maralt<-crop(alt,adm)
persp(maralt, exp=0.2,phi=35, xlab="Longitude", ylab="Latitude", zlab="Elevation")
But I can not figure out how to translate this to use the levelpersp function. How do I assign the x, y & z values?
Maybe you could share how you did that?