Pages

Monday, July 9, 2012

Trend and Spatial Pattern of Poverty in the Philippines

In a teaching demo that I have conducted, I discussed on how R can be used to analyze trends and spatial pattern of poverty incidence in the Philippines. Playing on the data I got from the National Statistical Coordination Board below is what I got.


 Scatter  Plot Matrix


Histogram


Poverty Incidence Map


Spatial Pattern


Sunday, July 1, 2012

Colored 3D Map

In my previous post, I showed how to make a 3D view of an area using the persp function. However, I felt this was not a complete representation, especially for digital elevation. While looking for some reference for my presentation on the use of R for data analysis and visualization, I came across a thread discussing " 3d plot with different levels done in different colors (solution)".  In this thread, a co-blogger Tamas K Papp's shared his levelpersp function. Using this function I tried to plot 3D view of Marinduque, Philippines using terrain and topo color.


3D persp using terrain color

3D persp using topo color


Sunday, June 17, 2012

Negros Quake Animation in R

Taken from a previous post in other website, maps below show the locations of epicenters and sequence of earthquakes that struck Negros last February 6, 2012. The bottom image is the animation these maps using animation package in R. Data was taken from United State Geological Survey.

3D Maps in R

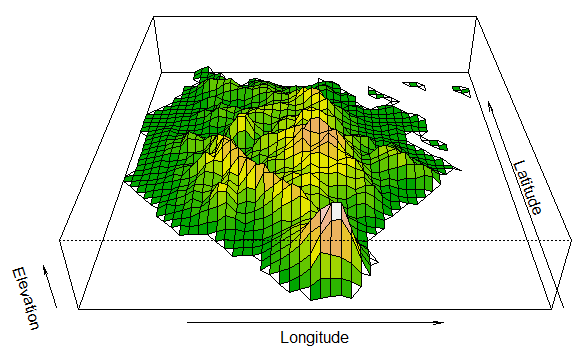
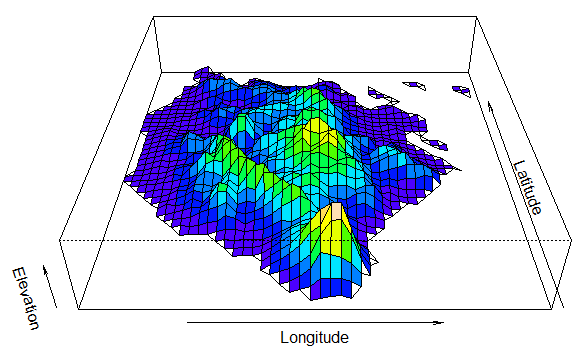
Talking about elevation, one can also plot a wire frame 3D view of an area using the persp function. Using the same data source from my previous post, 3D view of Marinduque, Philippines was produced using the following code below:


#############################################################################################
library(maptools)
library(raster)
alt <- getData('alt', country='PHL')
adm <- getData('GADM', country='PHL', leve=1)
mar<-(adm[adm$NAME_1=="Marinduque",])
maralt<-crop(alt,mar)
persp(maralt, exp=0.2,phi=35, xlab="Longitude", ylab="Latitude", zlab="Elevation")

#############################################################################################
 persp(maralt, exp=0.2,phi=35, xlab="Longitude", ylab="Latitude", zlab="Elevation", shade=0.45, col="green4")
#############################################################################################

Friday, June 15, 2012

Mindoro Digital Elevation Map

Saw a map produced by my previous student using a commercial GIS software.Using R raster package and data from diva-gis.org. I produced a similar map.


Friday, June 8, 2012

RSMC 2011 Typhoon Tracks

While at Puerto Princesa Airport in Palawan and waiting for my flight back to Manila, I opened my laptop and started doing what I usually do (practice my skills in R) during my idle time. With some inspirations from spatialanalysis.co.uk, I tried to make a map that maybe relevant to the Philippines (especially this coming rainy season).


Here is another version of the same map:


Thursday, June 7, 2012

Earthquake Density in the Philippines (2011-2012)


Using the same data and package from my previous post, but minor tweak on the code, I produced the map below: