

Showing posts with label Mapping with R. Show all posts
Showing posts with label Mapping with R. Show all posts
Sunday, June 15, 2014
Creating Inset Map with ggplot2
According to wiki.GIS.com one of the reason for using inset map is to provide a reference for an area for unfamiliar readers. Inset map is also considered a great asset for cartographers. Most of the GIS software available in the market have a provision for non-cartographer and beginners to create inset map. However, for R users who are into making maps, creating inset map is a bit challenging. Thanks to the post of Pascal Mickelson and Scott Chamberlain which gave users like me a guide on how to create inset map in R using ggplot2. Below is an example of map with inset created using R.
Sunday, June 1, 2014
Malawi Animated Rainfall Map
Couple of months ago, Charles Langton Vanya of Malawi contacted me on how to make animated rainfall map in R. I was very busy that I was not able to respond. Anyway, to Mr. Vanya, here is the code you can play on to produce a similar map as below.

Saturday, May 31, 2014
Mindoro Digital Elevation Map Updated
Almost 2 years ago, I made a post on creating digital elevation map using R. For that post, I used the basic R plotting function to create the map. Recently, I started learning to use ggplot2 package for visualizing data. Today, I created the same map that I did two years ago, using raster and gpplot2, its for you guys to tell the difference.
Happy Coding! Use R!

Before

After

Happy Coding! Use R!
Before
After
Tuesday, August 7, 2012
Provincial Monthly Rainfall of the Philippines from WORLDCLIM
Preparing for a future conference on climate change, I downloaded and extracted average monthly rainfall in the Philippines from worldclim.org. Using maptools, raster, and animation package in R, I produced an animation of average monthly rainfall of the country.

Monday, August 6, 2012
Provincial Map using GADM
This blog demonstrates how to produce political/provincial boundary map (below) using R maptools and raster packages.


Monday, July 9, 2012
Trend and Spatial Pattern of Poverty in the Philippines
In a teaching demo that I have conducted, I discussed on how R can be
used to analyze trends and spatial pattern of poverty incidence in the
Philippines. Playing on the data I got from the National Statistical Coordination Board below is what I got.

Scatter Plot Matrix

Histogram

Poverty Incidence Map

Spatial Pattern

Sunday, July 1, 2012
Colored 3D Map
In my previous post, I showed how to make a 3D view of an area using the persp function. However, I felt this was not a complete representation, especially for digital elevation. While looking for some reference for my presentation on the use of R for data analysis and visualization, I came across a thread discussing " 3d plot with different levels done in different colors (solution)". In this thread, a co-blogger Tamas K Papp's shared his levelpersp function. Using this function I tried to plot 3D view of Marinduque, Philippines using terrain and topo color.
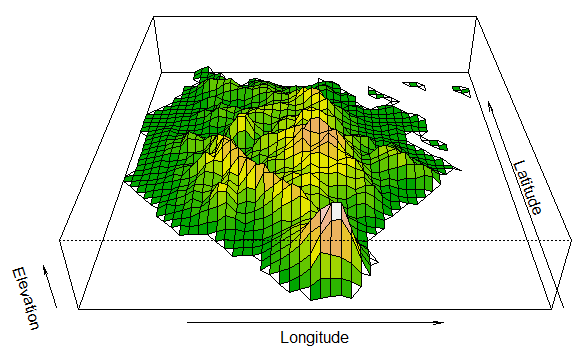 |
| 3D persp using terrain color |
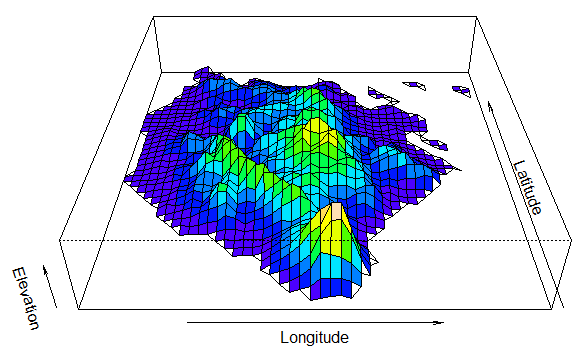 |
| 3D persp using topo color |
Sunday, June 17, 2012
Negros Quake Animation in R
Taken from a previous post in other website, maps below show the locations of epicenters and sequence of earthquakes that struck
Negros last February 6, 2012. The bottom image is the animation these maps using animation package in R. Data was taken from United State Geological Survey.


3D Maps in R
Talking about elevation, one can also plot a wire frame 3D view of an area using the persp function. Using the same data source from my previous post, 3D view of Marinduque, Philippines was produced using the following code below:


#############################################################################################
library(maptools)
library(raster)
alt <- getData('alt', country='PHL')
adm <- getData('GADM', country='PHL', leve=1)
mar<-(adm[adm$NAME_1=="Marinduque",])
maralt<-crop(alt,mar)
persp(maralt, exp=0.2,phi=35, xlab="Longitude", ylab="Latitude", zlab="Elevation")
#############################################################################################
persp(maralt, exp=0.2,phi=35, xlab="Longitude", ylab="Latitude", zlab="Elevation", shade=0.45, col="green4")
#############################################################################################
#############################################################################################
library(maptools)
library(raster)
alt <- getData('alt', country='PHL')
adm <- getData('GADM', country='PHL', leve=1)
mar<-(adm[adm$NAME_1=="Marinduque",])
maralt<-crop(alt,mar)
persp(maralt, exp=0.2,phi=35, xlab="Longitude", ylab="Latitude", zlab="Elevation")
#############################################################################################
persp(maralt, exp=0.2,phi=35, xlab="Longitude", ylab="Latitude", zlab="Elevation", shade=0.45, col="green4")
#############################################################################################
Friday, June 15, 2012
Mindoro Digital Elevation Map
Saw a map produced by my previous student using a commercial GIS software.Using R raster package and data from diva-gis.org. I produced a similar map.
Subscribe to:
Posts (Atom)