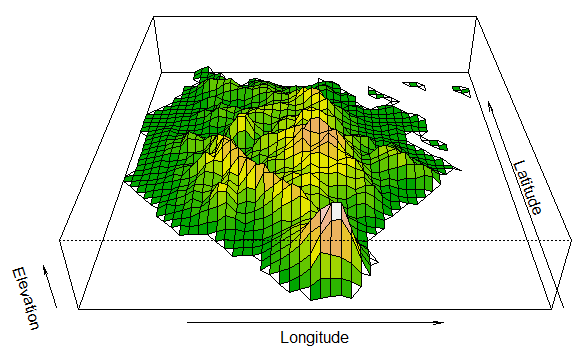
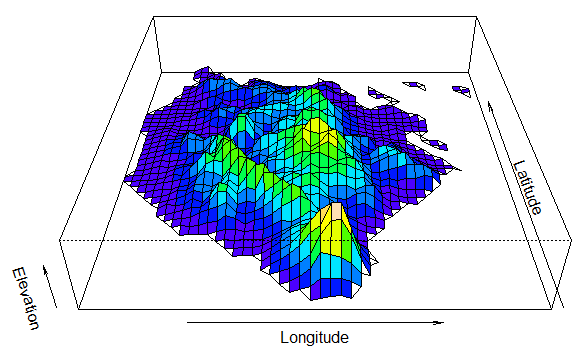
Talking about elevation, one can also plot a wire frame 3D view of an area using the
persp function. Using the same data source from my previous post, 3D view of
Marinduque, Philippines was produced using the following code below:
#############################################################################################
library(maptools)
library(raster)
alt <- getData('alt', country='PHL')
adm <- getData('GADM', country='PHL', leve=1)
mar<-(adm[adm$NAME_1=="Marinduque",])
maralt<-crop(alt,mar)
persp(maralt, exp=0.2,phi=35, xlab="Longitude", ylab="Latitude", zlab="Elevation")
#############################################################################################
persp(maralt, exp=0.2,phi=35, xlab="Longitude", ylab="Latitude", zlab="Elevation", shade=0.45, col="green4")
#############################################################################################