In my previous post, I showed how to make a 3D view of an area using the
persp function. However, I felt this was not a complete representation, especially for digital elevation. While looking for some reference for my presentation on the use of R for data analysis and visualization, I came across a thread discussing " 3d plot with different levels done in different colors (solution)". In this thread, a co-blogger
Tamas K Papp's shared his levelpersp function. Using this function I tried to plot 3D view of
Marinduque, Philippines using terrain and topo color.
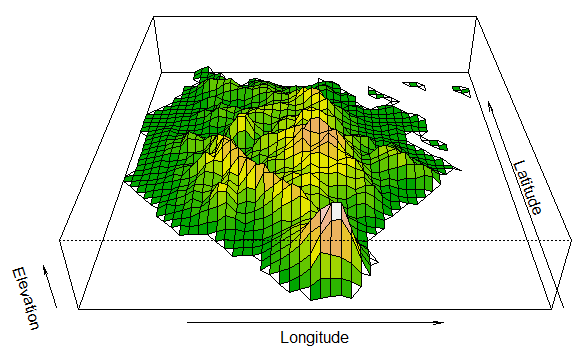 |
| 3D persp using terrain color |
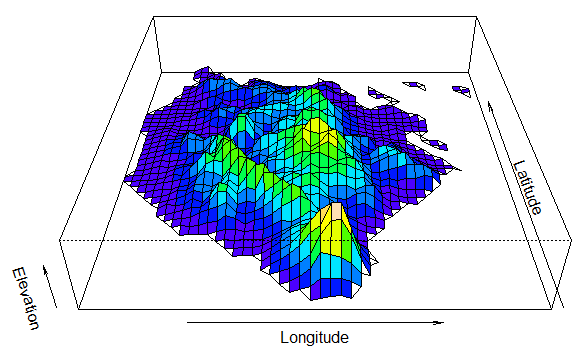 |
| 3D persp using topo color |


